> For the complete documentation index, see [llms.txt](https://docs.jentis.com/llms.txt). Markdown versions of documentation pages are available by appending `.md` to page URLs; this page is available as [Markdown](https://docs.jentis.com/getting-started/quickstart/preview-monitor.md).
# Test Before You Go Live
With server-side tracking architecture, a configuration preview is key. It makes transparent what is not visible to any third party or website visitor: the communication stream from user to any service provider (tools) made with your JENTIS server. The preview monitor enables you to preview and debug all data streams, be they client—or server-side tags and their streams.
To open the preview monitor, navigate to the "Containers" section that displays all containers with respective versions.
In the containers overview, you can click on the “Preview” button to open your website in preview mode with any version (the currently edited or any of your past versions published, which are available when selecting an individual container).
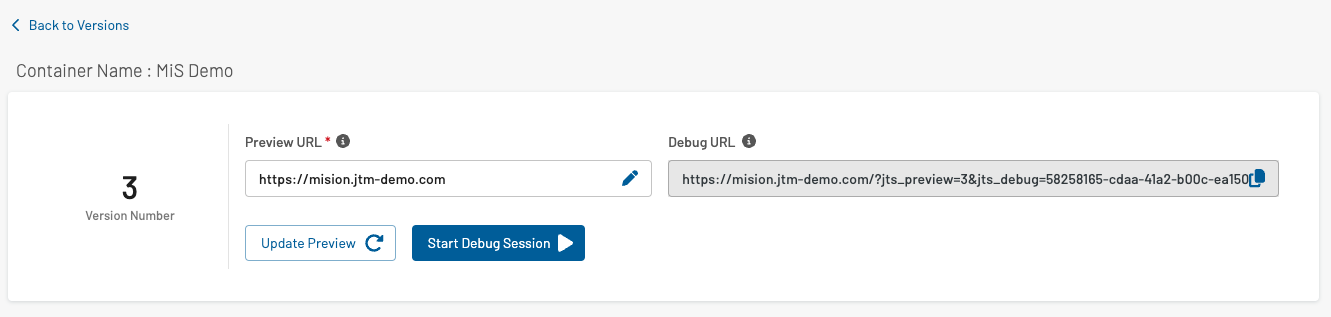
Now you can see in the preview tab the button to open your website (“Start Debug Session”-button) or copy paste the parameters to open your website manually.
{% hint style="warning" %}
You might need to allow the JENTIS DCP to open the popup in a new tab or window. Some browsers are blocking this action by default.
Please note that you can open the preview with any device or browser; it must not be opened in the same window as the current browser (that displays the data streams received in the preview).
{% endhint %}
The query parameters (`jts_preview`, `jts_debug` and `jts_log`) will instruct the JENTIS code in that website to display more information for debugging.
There are two levels to inspect the debugging information:
* client-side (in the browsers developer tools you can find information in the JS console); to fully inspect all client-side executed details the browsers tools can be used (ie. network protocol) or browser extensions (ie Google Tag Assistant in Chrome)
* server-side (in the JENTIS Preview window you'll see the server-side posted data streams and a brief client-side tag overview)
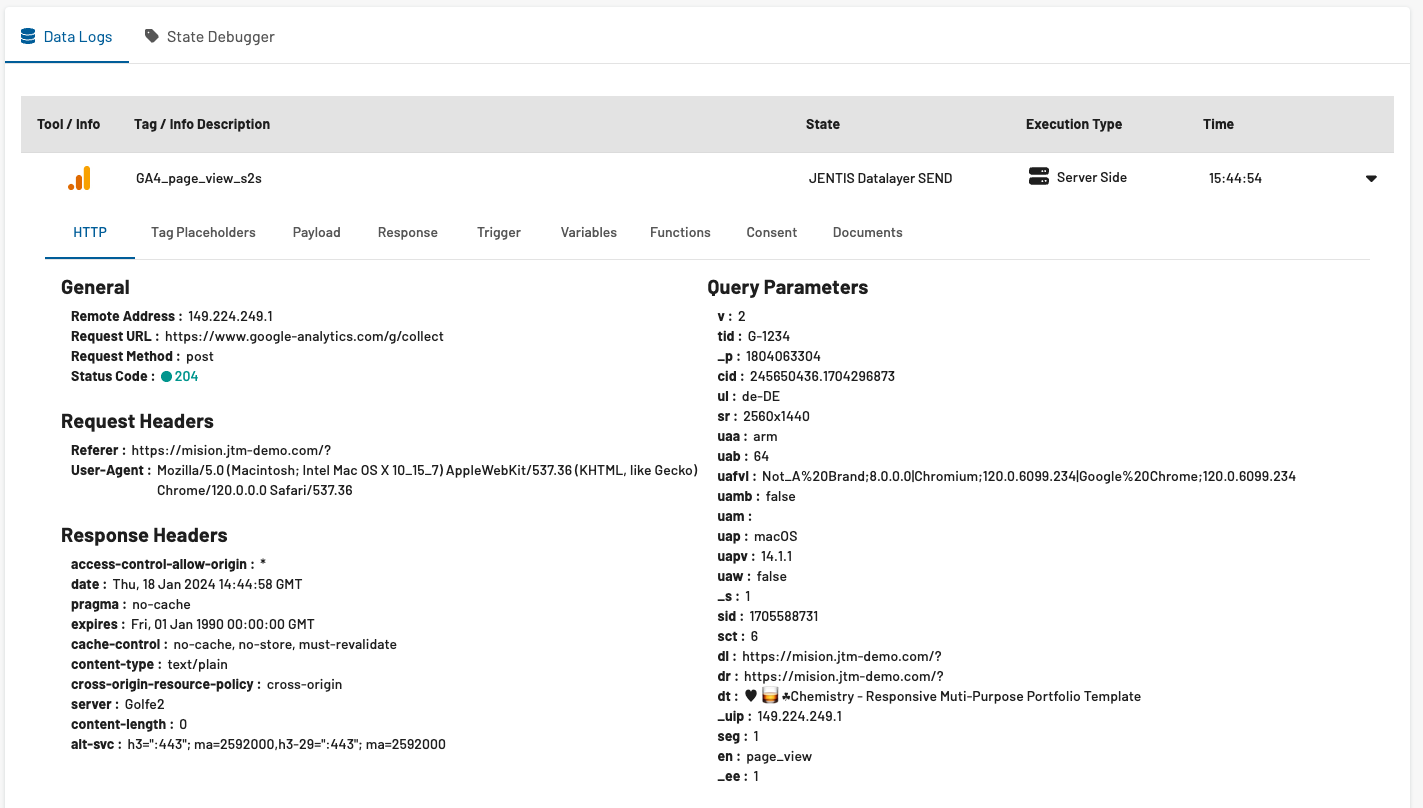
In the inspector window, you will see the incoming State events and the data that was then sent to a tool following a tag configuration.
The following example displays a data stream to a Google Analytics tools pageview-tag. It consists of the payload and HTTP parameters to check if the configuration meets your requirements.
There are two ways to present the preview data. The “Data Logs” view will simply log all the data streams as they appear and show the JENTIS system logs. The “State Debugger” view, however, will group all the data streams by the state (event) they executed based on.
---
# Agent Instructions
This documentation is published with GitBook. GitBook is the documentation platform designed so that both humans and AI agents can read, navigate, and reason over technical content effectively. Learn more at gitbook.com.
## Querying This Documentation
If you need additional information that is not directly available in this page, you can query the documentation by asking a question.
Perform an HTTP GET request on the following URL with the `ask` and `goal` query parameters:
```
GET https://docs.jentis.com/getting-started/quickstart/preview-monitor.md?ask=&goal=
```
`ask` is the immediate question: it should be specific, self-contained, and written in natural language.
`goal` is what the user is ultimately trying to achieve, the reason they need the answer. Sharing it helps GitBook give you a better, more relevant answer. A goal is most helpful when it describes the outcome the user wants rather than restating the question. For example, with `ask=how do I create an API token`, a goal like `automate deployments from our CI pipeline` lets GitBook tailor the answer to that use case.
The response will contain a direct answer to the question and relevant excerpts and sources from the documentation.
Use this mechanism when the answer is not explicitly present in the current page, you need clarification or additional context, or you want to retrieve related documentation sections.