Troubleshooting and Common Errors
The following section will be a living document where we add common questions and errors we observe. So you have a starting point to further investigate, what actually may cause troubles. As often some misinterpretations can lead to JENTIS code being not executed as designed.
Infinite Loading
On some occasions we observed the following error popping up in the browsers developer console. At the same time you can observe in the browsers developer tools network tab that the JENTIS JS file is loaded infinite times.
Uncaught RangeError
Maximum call stack size exceeded
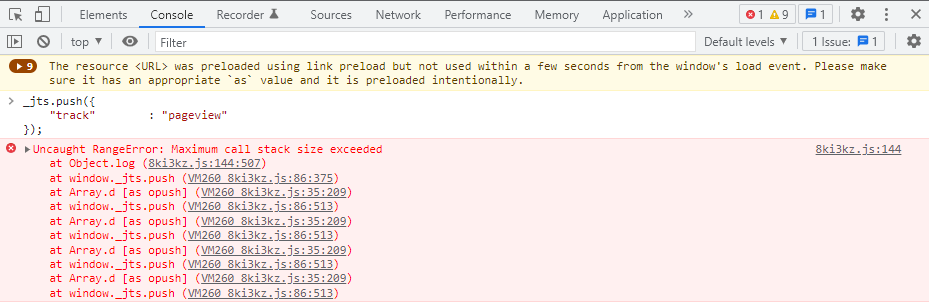
Root cause: the JENTIS basic tracking code snippet is loaded on a page multiple times.
Solution: Make sure to load the JENTIS tracking code snippet once on a page. Adding the same code twice to a page will result in JENTIS loading the according JS file in an infinite loop.
Details: Add JENTIS to your website
Redirect on Landing Page
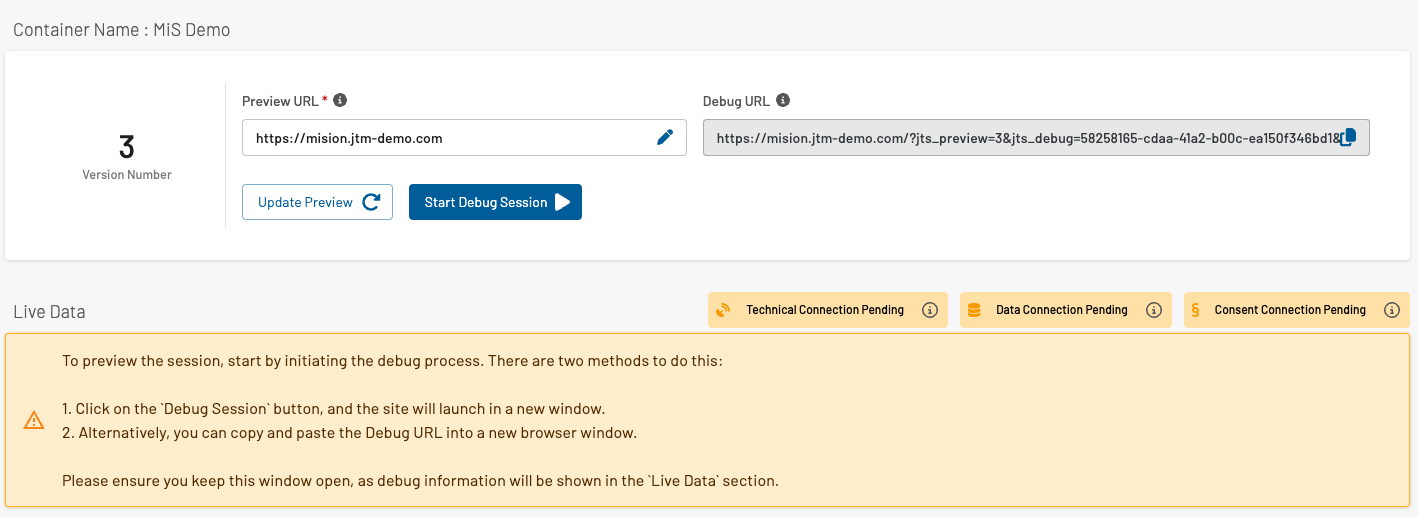
The connection for end-to-end testing with the Preview Monitor is enabled via URL Query Parameters that are added to the URL of your webpage you want to test. These Query Parameters are recognized by the JENTIS Web SDK to establish the connection to the actual Preview Version and the Preview Monitor.
If your landing page has a built-in redirect (for example regarding country and language), these parameters can be abandoned during the redirect, and no connection will be established to the Preview Monitor.
Solution: To overcome this problem you need to add the Query Parameters to the URL you are redirected to (given that the JENTIS Basic Tracking Code is implemented on that site). You can find the Query Parameters by right clicking the Play Button in the Preview Monitor UI and choose "copy link". From this copy you can now extract the right Parameters that need to be added to the end of the redirected URL.
Now you can add those parameters to any deep link URL on your site.
Console and INFO-Messages missing
Also on redirects and other dynamic factors the logs from the Browsers developer tools console might be missing.
You can always add the jts_log=1 query parameter to the url and reload the page. Now the console messages will appear as also the same info-messages on the preview server side.
Navigation to tabs
Even though the preview is not restricted to be done in the same web browser instance as the server-side preview window (you can open the websites URL with the preview-parameters on any other browser or even device). When a page is opened to be previewed, only this browsers tab will now be part of the preview. Navigating on a different page (by clicking a link) that opens in a different tab will not transport the session parameters. As they are only stored on the browsers sessionStorage, that is not shared between browser tabs commonly.
Meaning you must remain in the same window and tab during a session OR again append the URL-query parameters from the preview on the next tab.
No Consent Connection
Often no data appears in the Preview Monitors session because actually no data was ever sent from the client side to the server.
If you open the developer tools console in your browser you might see the following outcome:
“Consent Connection Pending”
In that case no consent for any tool was yet given. Which can be a result of a missing bridge to your Consent Management Platform.
Solution: Be sure to visit the Consent Manager section in your JENTIS Tag Manager account. There select each vendor (such as Google Analytics) to be active in your JTM Container and activate the CMP for this same JTM Container.
No Tracking Activated
In some cases the simple answer to missing data streams is that there was actually no submit call to actually send a pageview or any other event.
Make sure to actually start tracking by communicating via the _jts.push API (leveraging the tool agnostic approach of JENTIS) or connecting to any other action stream on your website (using custom JENTIS States, ie. listening for datalayer events).
The most basic call is:
_jts.push({track:"pageview"});
_jts.push({track:"submit"});
Click Tracking not executed
On navigational clicks (like a button to submit a form and hence forwarding the user to the next page displaying a "message received" page) there are race conditions involved. Meaning that it is not guaranteed that the click-event signal will be sent before the page unloads to make place for the next page to be displayed in the browser.
With this very tricky situation JENTIS Data Capturing platform provides some methods to mitigate the impact of lost data. And there are some topics that we must quickly cover before discussing solutions.
With each JENTIS state there is a grace period by default. This is a timeframe of 2000ms (2 seconds) that will give async variables and promises to be resolved before the actual JENTIS State is computed and data transmitted from client to the JENTIS server.
This feature is meant to provide the opportunity to use async variable computation with JENTIS. On the other side the conflict with the click-navigation arises that on this event there is not enough time to await this grace period.
To mitigate this impact you can make sure to not have any variable in your setup that returns explicitly "undefined" or is async. If no such variable is referenced the grace period will not be triggered and hence all data sent immediately.
Identifying such variables can be a bit tricky. However, when in preview and with the developer toolbox open in the console JENTIS will report async-variables:
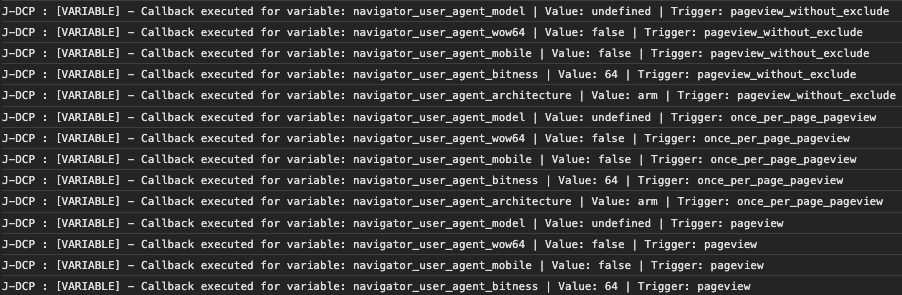
In the console log you will find the messages of "[VARIABLE] - Callback executed for variable" that indicate this situation described above.
You'd need to either not use those variables in the event of the click (meaning: it is not referenced in a tag or trigger) or if they are actually not async not return "undefined" but a value instead (maybe "" - empty string). This will make sure to circumvent the grace period.
Further in the near future an option will be available in JENTIS States to send all data via a secondary method. This will not have the grace period and will also use a different transport method than before. It is currently rolled out to beta testing accounts and will come to all accounts shortly (as of July 2023).
Click Tracking not executed - Further Troubleshooting
Another common issue with click and other action tracking (via JENTIS trigger "SELECTORACTION", see details here: Event & Interaction Tracking) is when the CSS selector seems not to get to work. Whenever you preview your click-interaction in the console and preview nothing pops up. Just like JENTIS is ignoring the click. Why is that?
HTML and DOM can be a grueling topic and web applications sometimes happen to interfere with each other or run into conflicts. This is sometimes the case with listening to click (and other) events propagated in the DOM of a page. Generally the click-trigger in JENTIS will use the Event Bubbling principle to listen for relevant events (find a good introduction to this topic here: https://www.freecodecamp.org/news/event-bubbling-in-javascript/ ). However, when another web app stops the bubbling the event propagation (via stopPropagation() function call) no information will arrive at the body of the website. And JENTIS will never receive any information of a click.
Unfortunately this situation is very tricky to further investigate or help with, as it always depends on individual implementations and website frameworks used. Hence why we can not provide any further tips to mitigate such conflicts.
However you can approach your website frontend developers and check with them, if any element in their app will stop the event propagation. If so, you have found the root cause and possible solve it there.
You can observe the situation on your site with the following two tests.
If the click listener is implemented on document level:
document.addEventListener('click', function(event) {
    // This function will check if the event target or any of its parents
    // match the given selector.
    function matchSelector(target, selector) {
        // Loop through the parent nodes until the document is reached.
        while (target && target !== document) {
            // Check if the current target matches the selector.
            if (target.matches(selector)) {
                return target;
            }
            // Move up in the DOM tree.
            target = target.parentNode;
        }
        return null;
    }

    // The selector for your specific element
    var selector = 'a[href*="Rent-a-Truck"]';

    // Check if the clicked element or any of its parents match the selector.
    var match = matchSelector(event.target, selector);

    if (match) {
        // Call your function here.
        console.log('Link with "Rent-a-Truck" in href clicked.');
        // You can replace this log with your function to be executed.
    }
});
This will not execute the console log message.
However, the same CSS selector when appended to the specific node will execute:
document.querySelectorAll('a[href*="Rent-a-Truck"]')[0].
addEventListener("click", x=>{
  console.log('Link with "Rent-a-Truck" in href clicked.');
});
Unfortunately there is no option on our end to change the situation.
You can do the following:
make sure the website is not breaking the event propagation as mentioned in the articles above
OR implement the click-tracking in a custom code in JENTIS Tag Manager (with appending the click event listener to the node directly and submit a _jts.push() with an event to activate a tracking with your tag manager) as a workaround
Click Tracking not executed - CSS and HTML issues
One more often encountered topic with click tracking is when some elements in HTML are more complex. Let's have a look into an example:
The button on this websites footer contains three elements:

<button ...>
<i ...> (icon)
" Yes " (text)
Or, if displayed with the dev tools, it looks like this:
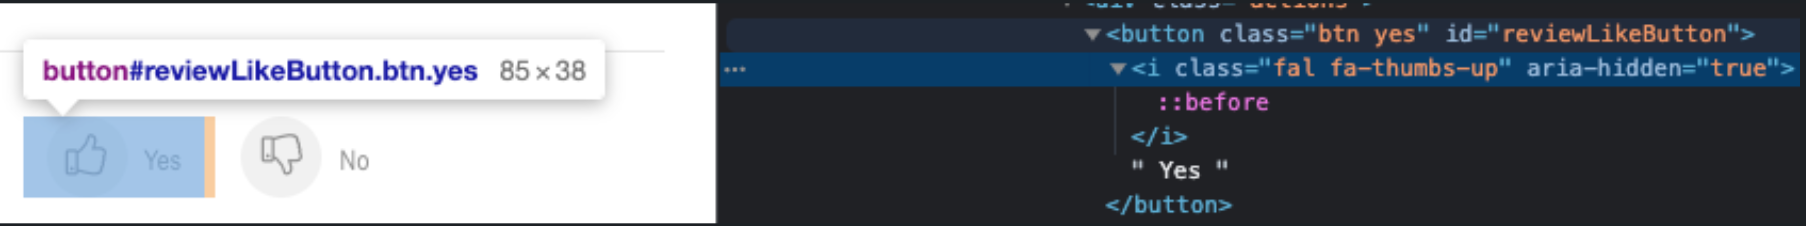
Now if you create a click-action trigger that activates on elements with the CSS selector ".btn yes", you will actually select just the button. But not the icon or text. So when the icon is clicked maybe there will be no click-trigger activated, as the browser might report the click on the icon and not the actual button. It can be quite frustrating, to find the right CSS selector.
Here are some tips to make it work smoothly:
use "OR" conditions within the CSS selector input field in JENTIS via ","
for example instead of just ".btn yes" you can also add ".btn yes, .fal fa-thumbs-up" to the list to also select the icon (via OR appended selectors)
use " > *" operators to select all child elements of the element of interest, ie: ".btn yes, .btn yes > *" (this selects the button OR the buttons all child elements)
With this tips we hope you can better identify and append the correct action trigger to your elements.
Click Tracking - Accessing Target URL Fails
Sometimes you need to read the href-value on a click, but as with a structure of HTML elements as in the previous example (a button that includes an icon, some text, etc) it can be tricky to actually get the URL where the user is navigating to.
To access the href value on a click from any complex HTML structure you can use the following code.
Simply add a new "Client Side" variable of "Client Side JavaScript Code". This will return the href-value regardless of how deep the structure is, it iterates through it until the root anchor ("a" HTML tag) is found.
function(contextObject){
  var result;
  if(contextObject && contextObject.element){
    var targetElement = contextObject.element;
    if (targetElement.tagName.toLowerCase() === "a") {
      result = targetElement.href;
    } else {
      // Traverse up the DOM tree to find the parent anchor
      while (targetElement &&
             targetElement.tagName.toLowerCase() !== "a" &&
             targetElement.tagName.toLowerCase() !== "body") {
        targetElement = targetElement.parentElement;
      }

      // If an anchor is found, log the href
      if (targetElement && targetElement.tagName.toLowerCase() !== "body") {
        result = targetElement.href;
      }
    }
  }
  return result;
}
Click Tracking - Debug with All Clicks as a Last Resort Measure
If all solutions provided above are still of no help you can use the following workaround as a measure of finding the root cause.
In this case you can create a “catch all” trigger that will activate on all clicks on your website. Connecting this to a tag will provide you a “scanner” tag that then displays the variable values that might be not what they should be. As generally JENTIS tags only activate (and also display in the preview) if the trigger conditions are met and a state is executed. Which can lead to situations where nothing appears in the preview, even though that something is expected to pop up on a certain click.
Here is a configuration of such a “catch all” trigger:
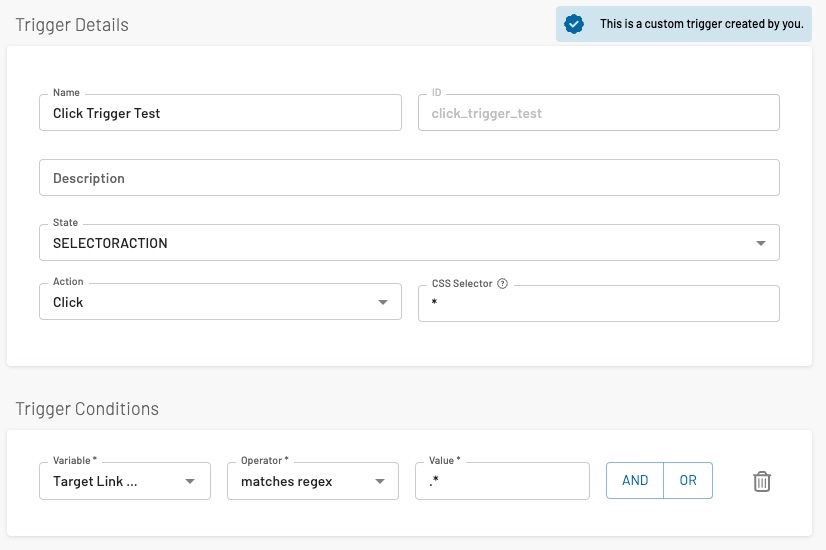
This trigger is set to the state “SELECTORACTION” for all click-actions with the CSS selector value *. All clicks are registered with this one.
It is a good idea to also select the variable in question (that might not be working as expected) in the trigger condition. As also variables will only be evaluated if they are actively used. Even for the preview.
Now connect this to a tag and start a preview session. In this example we will use a generic “Google Analytics event tag”. When a click is now processed on the website it will always pop up on your screen. In this tag you can now preview the trigger conditions and actual variable values. Regardless if the actual trigger conditions you are looking for are met or not.