Uplift in JTM lower than expected (compared to GTM)
What is the problem?
When comparing data in an analytics tool such as GA4 the data from the JENTIS related GA4 property reports less users/sessions/pageviews than a parallel implementation on the same website via client-side tag management (ie. GTM).
What is the solution?
Comparing apples to apples is a very tricky topic when it comes to client-side to server-side comparisons. There are most often a lot of caveats and hidden functionalities that impact the numbers in comparison that are actually not related to JENTIS.
The following must be done to provide the most accurate comparison possible:
narrow down the analysis to a not post-processing related metric:
sessions, users, bounce rate etc. are metrics that are calculated after all data of a given period is processed in the analytics tool. Some metrics however do not rely on further (or at least less) processing and therefore are much better for comparisons. Those are: pageviews or events that exactly report 1:1 to a measured interaction on the site. In GA4 the best metric to use is “Event Count” and a filter to the “Event Name = page_view”.narrow down the analysis to a single web page:
to rule out any navigational and web (frontend) application issues it is mandatory to also filter to a single web page. The most straight forward way is to only analyze the homepage. A possible regex filter would be:(^/$|^/\?.*)(which only matches page urls equal/OR/followed by url-query parameters)
What is the result of this comparison, narrowed down to the most simple tracking of a page_view event?
Further steps to check:
Consent:
Make sure to check if the client-side implementation applies consent correctly and the same way as the server-side implementation.
Steps to check:visit the site in an inkognito mode browser, is the page tracking any event before consent client-side with the analytics tool? Is the page tracking any event before consent server-side?
grant permission (consent) so the tools start tracking, is the client- and server-side event tracked correctly?
close the inkognito mode and open again: now deny the consent, is the result still the same to both tools?
Page speed and trigger-event:
What is the trigger activating the event you are looking for (ie. the page_view on the homepage) for the client- and server-side instance? Sometimes client-side the event is tracked immediately and the server-side maybe only on DOMready, which can happen seconds later.
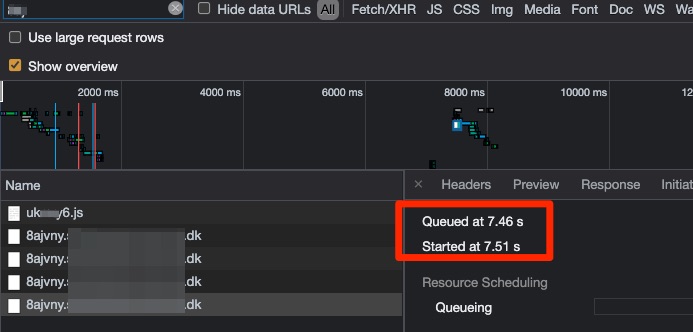
Check in the browsers dev tools the network tab. There look for the Queued at and Started at times. Compare the server-side and client-side events, is there a significant time gap?
Account Setup and Filters
Check the account setup and possible filters and data processors that apply after data collection. That can be “Internal Traffic” filters or similar settings on property and data stream level.
