Debug session is not connecting
What is the Problem?
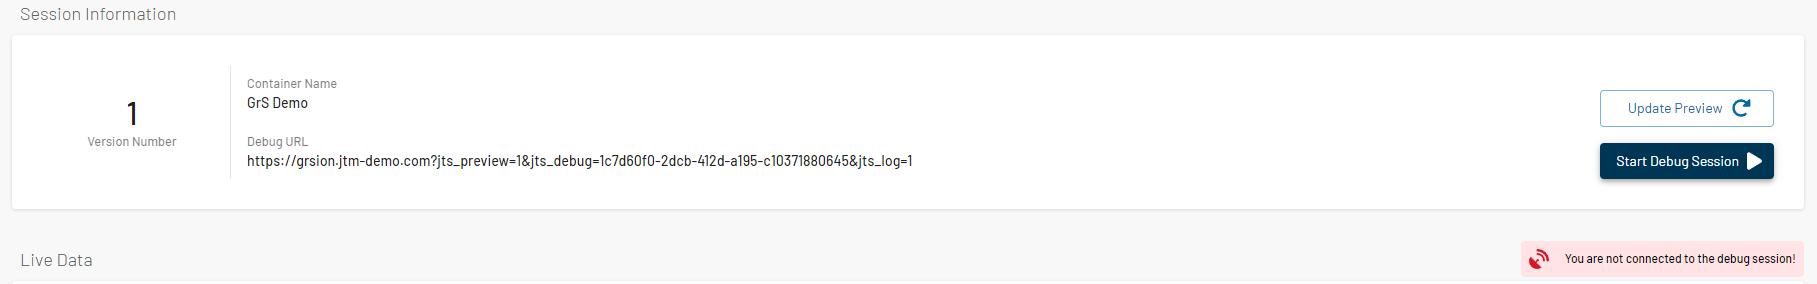
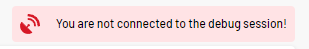
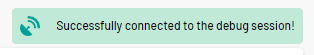
My JENTIS Debug Session is not connecting. “You are not connected to the debug session!”
Sometimes, the debug session may fail to connect due to various reasons, such as page redirection based on the user's country or other factors. Despite initiating the debug session, it remains disconnected, hindering the ability to effectively monitor and troubleshoot tracking debugging.
What is the Solution?
To resolve the issue of a disconnected debug session, follow these steps:
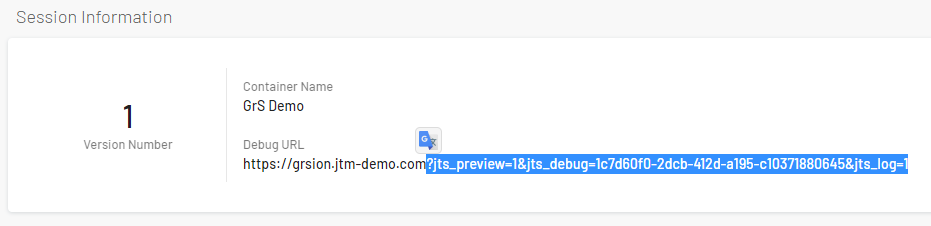
Copy Debug URL Parameters: When launching the debug session, note the part of the Debug URL that appears after the "?" character. This section contains query parameters necessary for debugging.
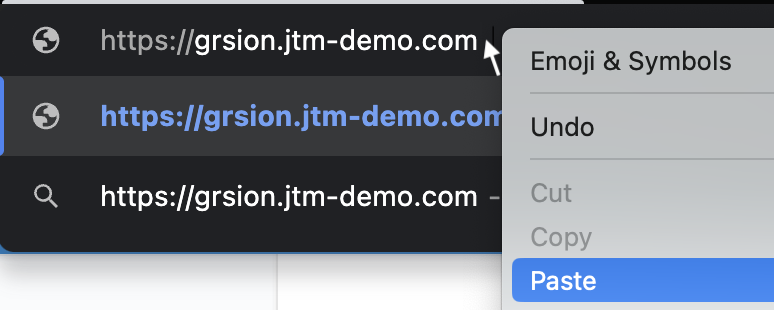
Append Query Parameters to Website URL: After copying the relevant query parameters, paste them immediately after the URL of the website you wish to debug. This action ensures that the JENTIS Script is loaded in the Debug Mode.
Load the Page: Once you have appended the query parameters, hit the enter key to load the page with the debug session data. Now check the Debug Monitor in your JENTIS DCP for the connection status.
Debug session is still not working?
It could be that the website you are working with, is deleting the query parameters and the JENTIS javascript is not able to pick that up. In this case, you can still manually enter these values into the session storage to ensure the connection to the JENTIS debugger. In this example, the query parameters are:
jts_preview=1
jts_debug=1c7d60f0-2dcb-412d-a195-c10371880645
jts_log=1
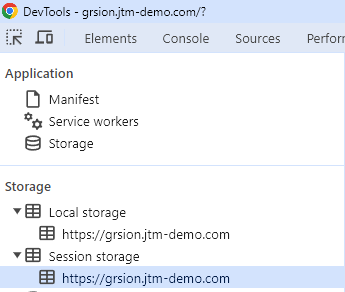
To add these values to the session storage, navigate to your website, and open the developer tools by pressing F12. Then here, navigate to the Application tab and search for your domain in the Session storage on the left side:
Once you find this menu point, add all the parameters one by one to the session storage like this:

Summary:
Experiencing a disconnected debug session can occur due to factors like page redirection based on user location. To address this problem, copy the query parameters from the Debug URL and append them directly to the URL of the website you want to debug. By doing so, you ensure that the debug session has the required data for proper connection. If query parameters are not supported on your website, follow the guide on how to connect to the debugger by manually adding the parameters to the session storage. Following these steps should resolve the issue, allowing you to successfully connect and use the debug session to monitor and troubleshoot tracking activities.